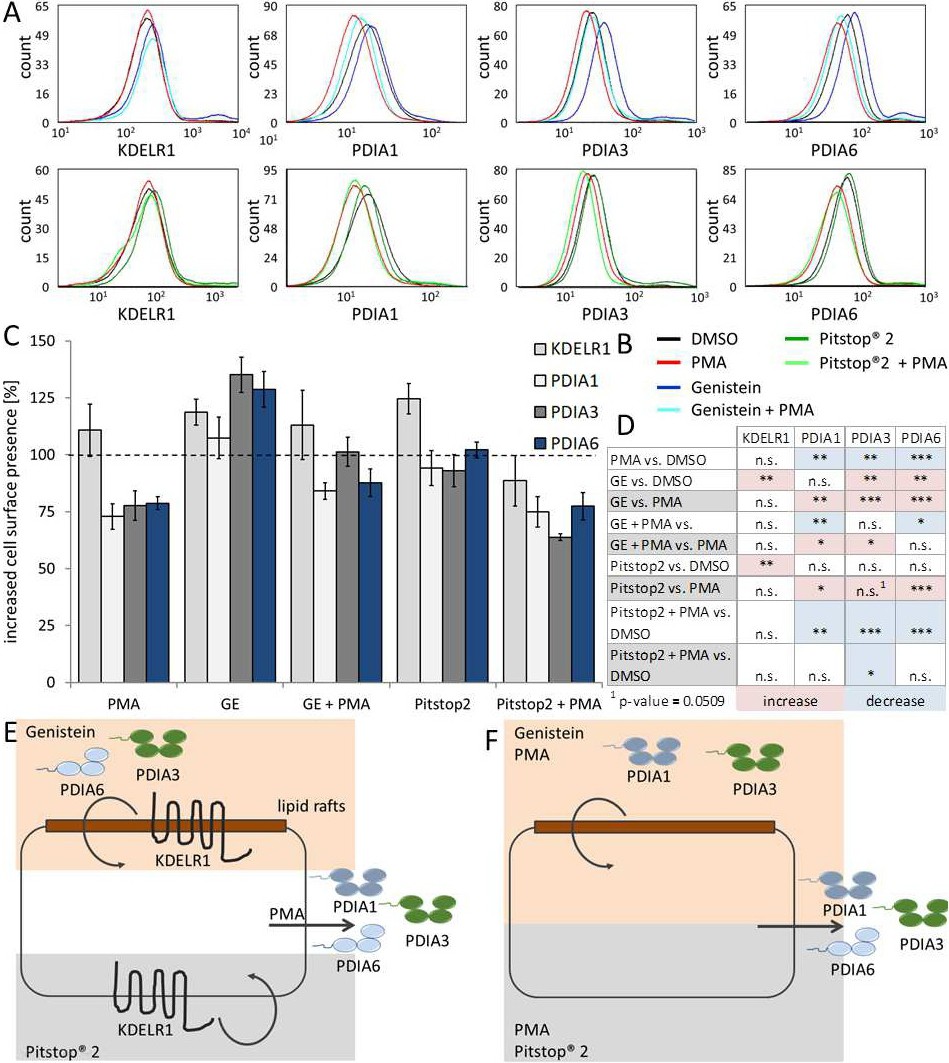
Fig. 5. The transport of the KDELR1 and PDIs to the plasma membrane is dynamic. (A) Representative graphs of the flow cytometric analysis of the cell surface expression of KDELR1, PDIA1, PDIA3, and PDIA6 after treatment as indicated in Fig. 5B. (B) Before staining, cells were treated with DMSO, Pitstop(r) 2 (inhibitor of clathrin-dependent endocytosis), Genistein (GE, inhibitor of caveolin-dependent endocytosis), PMA (activator of protein kinase C), PMA with GE, or PMA with Pitstop(r) 2 for 1.5 hours. (C) A bar diagram summarizing the results of three independent flow cytometric analyses presented in Fig. 5A. (D) Overview of the up (red) and down (blue) regulated cell surface presence of the indicated proteins following the various treatments, with indicated significances with respect to either DMSO- or PMA-treated samples. (E) Schematic drawing of the secretion of PDIs upon PMA treatment and increased cell surface presence attributable to the blockade of the caveolin-dependent pathway (GE) or clathrin-dependent pathway (Pitstop(r) 2). KDELR1 is endocytosed via both pathways. In resting cells, PDIA3 and PDIA6 are endocytosed via the caveolin-dependent route. (F) Co-treatment of HEK293T cells with PMA and GE or Pitstop(r) 2 results in decreased cell surface presence compared with corresponding samples without PMA, probably because of the secretion of PDIs. Comparison of solely PMA-treated and the GE/ PMA co-treated samples showing a significant increase in the cell surface presence of PDIA1 in the GE-treated sample because of decreased endocytosis via the caveolin-dependent pathway. The Pitstop(r) 2/ PMA co-treated samples exhibit a significant decrease in the cell surface presence of PDIA3 in the case of the PMA only treatment. This might also be the result of to a reduction of PDIA3 at the cell surface caused by an increase in caveolin-dependent endocytosis attributable to PMA stimulation.